global_sp <- creatsp("D:/Rdata/zhc/article/part2/fan/s966_section/")

print(global_sp)
sp data with 599 samples for 7748 featuresData quality control of the spverse package is implemented through three sequential procedures: initial low-quality sample filtering, intermediate data normalization, and final missing value imputation.
First, read the data and create the sp object.
global_sp <- creatsp("D:/Rdata/zhc/article/part2/fan/s966_section/")
print(global_sp)sp data with 599 samples for 7748 featuresThe raw data contains 599 spots and 7748 features. Next, low-quality samples were excluded using the filter_sample_sp() function, which stores the results in the slot named clean_data. The times parameter retained its default setting of 1.5-fold, and the group parameter is not set.
global_sp <- filter_sample_sp(global_sp,times = 1.5)

dim(global_sp@clean_data)
[1] 7746 571After filtering with the filter_sample_sp() function, 28 samples were removed, leaving 571 samples remaining.
filter_plot_sp(global_sp,times = 1.5)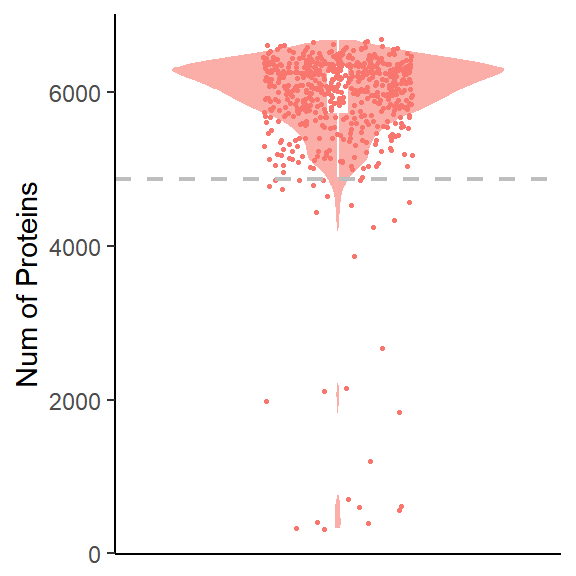
If you have performed normalization in the search software, spverse does not recommend performing normalization again. We suggest first examining the overall distribution of the data to assess whether normalization is necessary.
density_plot_sp(global_sp)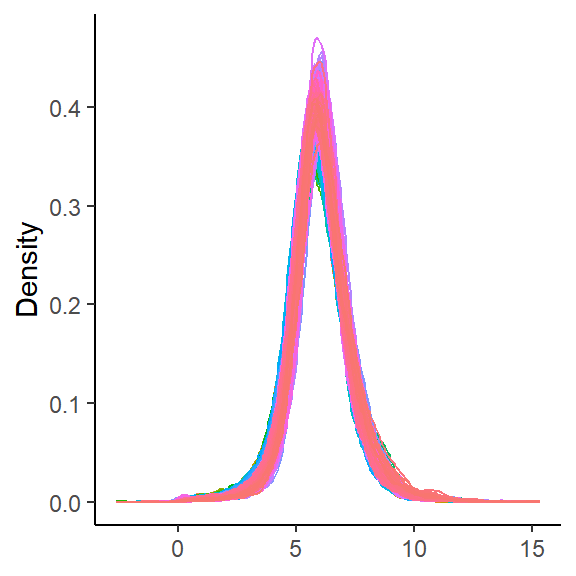
No significant differences were observed in the distribution of any sample compared to others in the probability density plot, so normalization is unnecessary.
Next, we used the default “impseqrob” method for missing value imputation, and filtered out proteins detected in fewer than 30% of spots.
global_sp <- mvi_sp(global_sp,method = "impseqrob",nmr = 0.3)

density_plot_sp(global_sp)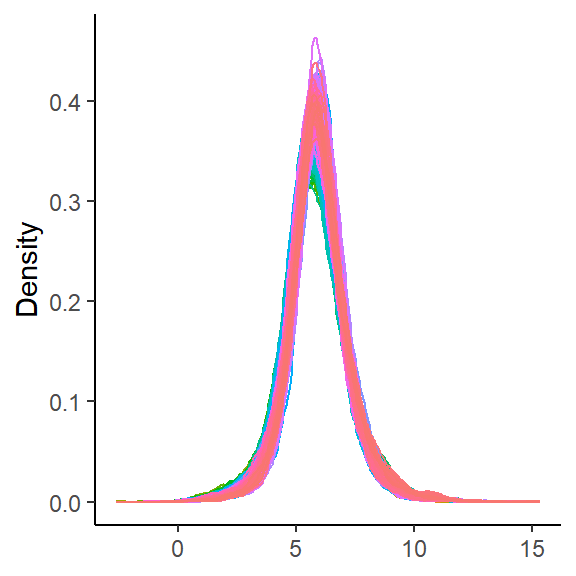
After missing value imputation, the samples also exhibit a normal distribution. Thus, the data quality control process is complete.